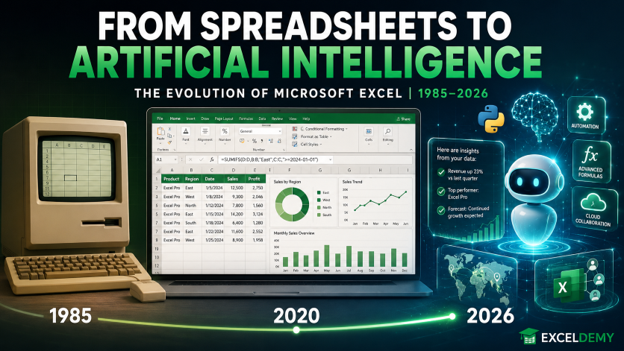
How Excel evolved from an electronic calculation grid into a collaborative, programmable and AI-assisted business-analysis platform.
Imagine entering a finance department, marketing office, HR team, retail business, manufacturing unit or multinational corporation and asking:
“Which software do you use to organise, calculate or analyse business data?”
The answer will often include one familiar name—Microsoft Excel.
Excel has been helping people work with data for more than four decades. It has survived the arrival of databases, enterprise resource planning systems, cloud platforms, business-intelligence tools, programming languages and artificial intelligence.
But Excel has not merely survived. It has continued to evolve.
What began as an electronic spreadsheet is now a powerful business tool capable of data cleaning, financial modelling, interactive reporting, automation, advanced analytics, Python-based analysis and AI-assisted workbook creation.
So, why is Excel still used by companies worldwide? To understand that, let us first travel through its remarkable timeline.
Before spreadsheets became common, business calculations were performed using paper-based registers, calculators and manually prepared reports.
Even a minor change in a budget, sales forecast or financial statement could require several calculations to be repeated. This process was slow and created a high risk of human error.
The Beginning: Business Calculations Before Excel
Early spreadsheet programs demonstrated that calculations could be performed electronically. Microsoft then entered this growing field and introduced a product that would eventually become one of the most recognised business applications in the world.
Microsoft celebrated Excel’s 40th anniversary in 2025, marking four decades since its original release. According to Microsoft, Excel has continued to develop from a traditional grid-based spreadsheet into an intelligent and collaborative data-analysis platform. Microsoft Excel Turns 40
The Evolution of Microsoft Excel: 1985–2026
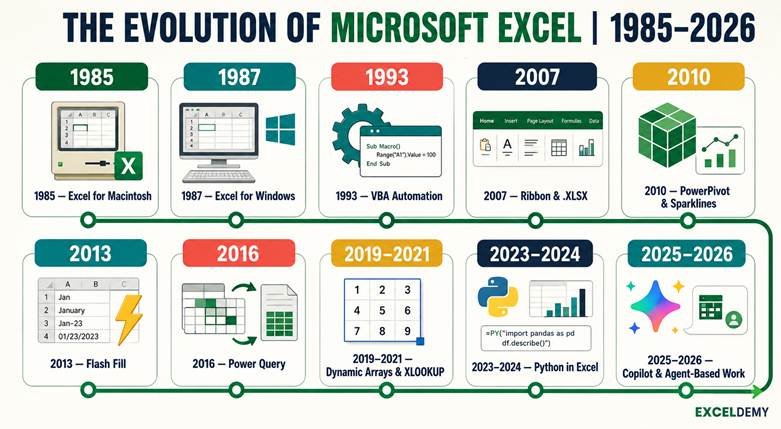
Figure 1. Key milestones in Excel’s development from the Macintosh release to Copilot and agent-based work.
1985: The First Version of Excel
Microsoft Excel was first released for the Apple Macintosh in 1985.
Its graphical interface helped users perform calculations, organise information and create charts more easily than with many earlier spreadsheet applications.
The basic idea was simple but powerful:
Enter data once, create formulas and allow the results to update automatically whenever the data changes.
This principle remains at the heart of Excel even today.
1987: Excel Arrives on Windows
The Windows version of Excel was released in 1987.
As Microsoft Windows gained popularity, Excel became increasingly accessible to businesses, educational institutions and individual users.
The combination of Excel and Windows helped establish the graphical spreadsheet as a standard business tool.
The Early 1990s: Better Charts, Formatting and Usability
During the early 1990s, Excel gained improved toolbars, drawing capabilities, charts, formatting options and worksheet-management features.
Users could now do much more than enter numbers. They could create structured business reports and visually communicate their results.
1993: Visual Basic for Applications and Workbook Automation
Excel 5.0 introduced Visual Basic for Applications, commonly called VBA.
VBA allowed users to automate repetitive work, create customised procedures and build more advanced business solutions inside Excel.
Tasks such as formatting monthly reports, cleaning recurring datasets, creating multiple worksheets and generating standard summaries could now be automated.
This development transformed Excel from a calculation tool into a programmable business platform.
1995: Excel Enters the 32-Bit Era
Excel 95 was designed for the 32-bit Windows environment.
This helped Excel work more effectively with the rapidly developing Windows operating system and supported the increasing use of personal computers in organisations.
1997–2003: Excel Becomes a Business Standard
During this period, Excel received improvements in:
- Formulas and functions
- PivotTables
- Charts
- Data validation
- Conditional Formatting
- External-data connectivity
- Macro development
- Workbook protection
- Collaboration
By the early 2000s, Excel was widely used for budgeting, payroll, inventory control, financial reporting, sales analysis and management information systems.
2007: A Major Change in the Excel Interface
Excel 2007 introduced the Ribbon interface and the modern .xlsx workbook format.
The worksheet capacity also increased dramatically to:
- 1,048,576 rows
- 16,384 columns
This allowed organisations to work with much larger datasets than earlier versions could support.
New features, improved Conditional Formatting and enhanced tables also made business reporting more visual and structured.
2010: Sparklines, PowerPivot and Stronger Analytics
Excel 2010 introduced features such as Sparklines and expanded analytical capabilities.
PowerPivot allowed users to create data models, connect related tables and perform more powerful calculations using large datasets.
Excel was no longer limited to analysing one simple worksheet at a time. It was moving towards business intelligence and multidimensional analysis.
2013: Flash Fill and Easier Data Preparation
Excel 2013 introduced Flash Fill, which could recognise patterns and automatically complete text-based transformations.
For example, if a user manually separated one employee’s full name into first and last names, Flash Fill could detect the pattern and complete the remaining rows.
Power Query also emerged as an important data-import and transformation capability.
2016: Power Query Becomes an Integrated Excel Feature
Power Query became integrated into Excel through the Get & Transform Data tools.
It allowed users to:
- Import data from different sources
- Remove unwanted rows and columns
- Change data types
- Merge and append tables
- Split and combine fields
- Refresh reports when source data changed
Microsoft describes Power Query as a data-connectivity and preparation technology that can import and reshape information from multiple sources across Excel and other Microsoft products. Microsoft Power Query Documentation
This significantly reduced the need to perform the same cleaning steps manually every month.
2019–2021: Dynamic Arrays and Modern Excel Functions
Modern functions such as the following changed how formulas were created:
- XLOOKUP
- XMATCH
- FILTER
- SORT
- SORTBY
- UNIQUE
- SEQUENCE
- LET
Dynamic-array formulas could return multiple results automatically instead of requiring users to copy the same formula into several cells.
XLOOKUP provided a more flexible alternative to traditional lookup methods, while LET made complex formulas more readable and efficient.
2023: Python Comes to Excel
In 2023, Microsoft announced Python in Excel.
Python gave users access to advanced data-analysis and visualisation capabilities while continuing to work inside the familiar Excel environment.
Users could combine Python libraries with Excel formulas, charts and PivotTables. Microsoft’s Introduction to Python in Excel
2024: Python in Excel Reaches General Availability
Python in Excel became generally available for supported Microsoft 365 users in 2024.
This development brought spreadsheet analysis and programming-based analysis closer together. Users could perform statistical analysis, data transformation and advanced visualisation without transferring their entire workflow to a separate programming environment.
2025: Excel Celebrates 40 Years and Expands AI Capabilities
In 2025, Excel completed 40 years.
Copilot continued to expand inside Excel, helping users generate formulas, identify insights, create charts and PivotTables, format data and work with natural-language instructions.
This represented an important shift:
Users were no longer limited to telling Excel how to perform every step. They could increasingly describe the result they wanted to achieve.
2026: Excel Moves Towards Agent-Based Working
In 2026, Excel’s development continued with more advanced Copilot and agent-based capabilities.
Copilot in Excel can help users edit worksheets, generate formulas, create charts and PivotTables, summarise data, detect trends and complete multistep workbook tasks. Microsoft’s current experience includes edit, plan and chat modes, although availability can depend on the Microsoft 365 licence and organisational settings. Microsoft Support: Get Started with Copilot in Excel
Excel also introduced functions including IMPORTTEXT and IMPORTCSV, designed to load external text or CSV data into refreshable dynamic arrays using formulas. What’s New in Excel—January 2026
Further 2026 updates included new Copilot entry points, smart suggestions, keyboard-focused improvements and enhanced change tracking. What’s New in Excel—May 2026
Excel has therefore moved far beyond its original identity as an electronic calculator. It is developing into an intelligent workspace where people can prepare, analyse, visualise and communicate data.
Why Do So Many Companies Still Use Excel?
Modern organisations have access to databases, ERP software, customer-relationship management systems, Power BI, Tableau, Python, R and specialised industry applications.
Yet Excel remains deeply embedded in everyday business operations.
Here are the major reasons.
1. Excel Is Familiar and Widely Accessible
Millions of employees, managers, teachers, students and business owners already understand the basic Excel interface.
Rows, columns, formulas and tables are easy to recognise. A beginner can enter data and calculate a total within minutes, while an advanced user can create an automated financial model or interactive dashboard.
This combination of simplicity and depth is difficult to replace.
2. It Works Across Almost Every Business Department
Excel is not limited to accountants or data analysts.
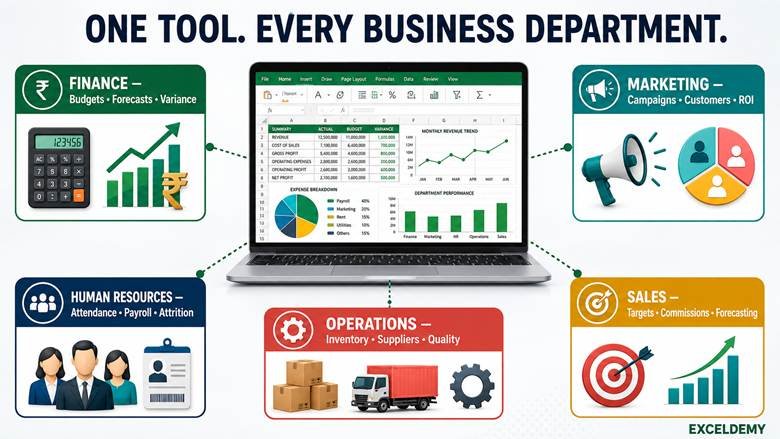
Figure 2. Excel supports analysis and reporting across finance, marketing, human resources, operations and sales.
Finance and Accounting
Finance teams use Excel for:
- Budget preparation
- Variance analysis
- Cash-flow forecasting
- Financial modelling
- Loan and investment calculations
- Account reconciliation
- Profitability analysis
- Management reporting
Marketing
Marketing professionals use it for:
- Campaign-performance analysis
- Customer segmentation
- Lead tracking
- Sales-funnel analysis
- Market research
- Pricing analysis
- Return-on-investment calculations
Human Resources
HR departments use Excel for:
- Employee records
- Attendance analysis
- Salary calculations
- Performance evaluation
- Recruitment tracking
- Training records
- Attrition analysis
- Workforce planning
Operations and Supply Chain
Operations teams use it for:
- Inventory management
- Supplier evaluation
- Order tracking
- Demand forecasting
- Logistics analysis
- Quality control
- Production planning
- Service-level monitoring
Sales
Sales teams use Excel for:
- Monthly sales reports
- Territory analysis
- Target-versus-achievement reports
- Commission calculations
- Customer tracking
- Product-performance analysis
- Sales forecasting
Excel remains popular because one application can support all these different requirements.
3. It Offers Speed and Flexibility
A business question may arise unexpectedly:
- Which region missed its target?
- Which customers have overdue payments?
- Which products generated the highest profit?
- Which department exceeded its budget?
- Which suppliers are creating delivery delays?
Instead of waiting for a complete software application to be developed, an employee can often import the data into Excel, apply formulas, create a PivotTable and prepare an initial answer quickly.
Excel is especially valuable for exploratory work, ad hoc analysis and one-time business decisions.
4. It Connects with Other Business Systems
Companies do not always use Excel as their primary database. Instead, they often use it as the final analysis or reporting layer.
Data can be exported to Excel from:
- ERP systems
- Accounting software
- CRM platforms
- HR systems
- Banking applications
- Web portals
- SQL databases
- Cloud platforms
- Power BI and other reporting tools
Excel acts as a bridge between structured corporate systems and the employees who need to examine, verify or present the information.
5. It Supports Both Beginners and Advanced Users
A beginner may use:
- SUM
- AVERAGE
- COUNT
- Sorting
- Filtering
- Basic charts
An intermediate user may use:
- IF
- SUMIFS
- COUNTIFS
- XLOOKUP
- PivotTables
- Conditional Formatting
An advanced user may work with:
- Power Query
- Power Pivot
- DAX
- Dynamic arrays
- Macros and VBA
- Python in Excel
- Copilot
- Automated dashboards
Employees can continue developing their skills without having to abandon the tool they already know.
6. Excel Makes Business Logic Visible
In many software systems, calculations happen behind the interface.
In Excel, users can select a cell and inspect the formula. They can follow references, check inputs and trace the source of an output.
This visibility is useful for learning, checking assumptions and explaining calculations to managers or clients.
However, visibility does not automatically guarantee accuracy. Important workbooks should still be reviewed, documented and protected.
7. It Is Excellent for Prototyping
Before an organisation invests in a new application, database or automated reporting solution, it may first develop the process in Excel.
A team can test:
- What information should be captured
- Which calculations are required
- Which KPIs are useful
- How reports should be presented
- Which decisions the analysis should support
Once the process is stable, it can be transferred to a more specialised system if necessary.
8. Excel Supports Fast Visual Communication
Charts, PivotCharts, Conditional Formatting, Sparklines and dashboards help convert raw data into information that managers can understand.
A well-designed Excel report can quickly highlight:
- High-performing products
- Declining sales
- Budget overruns
- Delayed payments
- Low inventory
- High-risk customers
- Departmental performance
This ability to move from raw data to a decision-ready report is one of Excel’s greatest strengths.
9. It Can Automate Repetitive Work
Power Query can record repeatable data-cleaning steps, while macros can automate actions such as formatting, calculations and report preparation.
A monthly process that once required several hours may be reduced to refreshing a query, updating a PivotTable or running a recorded macro.
10. Excel Is a Common Business Language
Different organisations use different ERP, CRM and analytics platforms. However, an Excel workbook can usually be opened, reviewed and understood by a wide range of people.
That makes Excel a practical format for exchanging:
- Budgets
- Reports
- Schedules
- Calculations
- Reconciliations
- Forecasts
- Data extracts
- Management summaries
A workbook often becomes the meeting point between finance, marketing, HR, operations, IT and senior management.
Is Excel Still Relevant When We Have Power BI, Tableau, Python and AI?
Yes—but Excel should be used for the right purpose.
Excel is excellent for:
- Quick analysis
- Business calculations
- Small and medium-sized datasets
- Financial models
- Operational trackers
- Scenario analysis
- Data validation
- Prototypes
- Individual and team-level reporting
Power BI and Tableau are generally better for enterprise-scale dashboards, controlled distribution and interactive visual analytics.
SQL databases are better for storing large, structured and frequently updated datasets.
Python and R are better for advanced statistics, machine learning and highly customised analytical processes.
The most effective professionals do not treat these tools as competitors. They combine them.
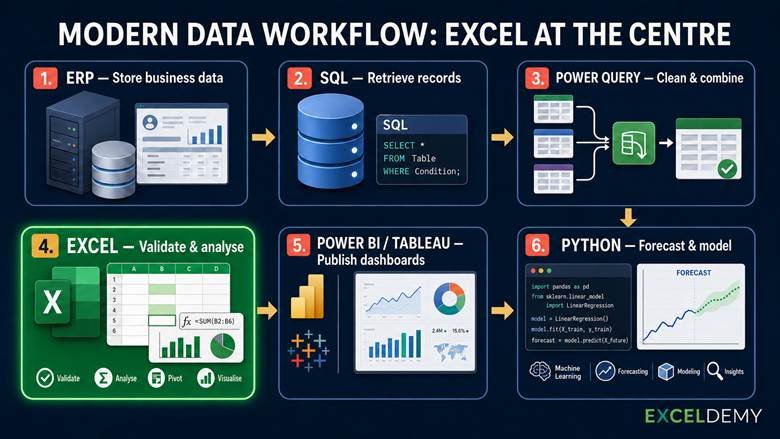
Figure 3. A modern analytics workflow in which Excel validates and analyses data between preparation and advanced reporting.
For example:
- Data may be stored in an ERP system.
- SQL may retrieve the required records.
- Power Query may clean and combine the data.
- Excel may validate calculations and perform ad hoc analysis.
- Power BI or Tableau may publish the final dashboard.
- Python may support forecasting or machine-learning models.
Excel often remains at the centre because it is the tool through which business users can directly explore and understand the data.
The Real Need for Excel in 2026
The need for Excel is no longer limited to remembering formulas.
Modern professionals should understand how to:
- Structure data correctly
- Select the appropriate formula
- Clean data through Power Query
- Use PivotTables for summarisation
- Create decision-oriented dashboards
- Automate repetitive tasks
- Validate outputs
- Protect sensitive information
- Use AI responsibly
- Convert data into meaningful business recommendations
AI may generate formulas and reports, but users must still understand:
- Whether the source data is correct
- Whether the chosen calculation is appropriate
- Whether the output makes business sense
- Whether important exceptions were ignored
- Whether the final decision is ethical and reliable
AI does not remove the need to learn Excel. It changes the level at which Excel users are expected to think.
What Excel Skills Should Students and Professionals Learn?
A practical learning path should include:
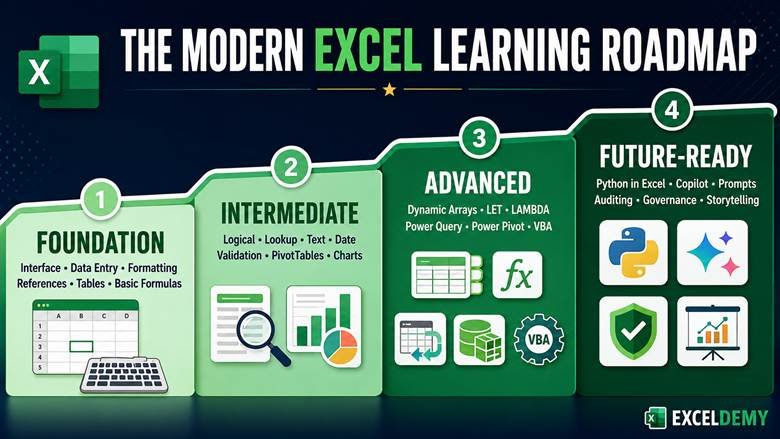
Figure 4. A progressive Excel learning path from foundation skills to Python, Copilot, governance and storytelling.
Foundation Level
- Excel interface
- Data entry and formatting
- Cell references
- Tables
- Sorting and filtering
- Basic formulas and functions
- Basic charts
Intermediate Level
- Logical functions
- Lookup functions
- Text functions
- Date and time functions
- Conditional Formatting
- Data validation
- PivotTables and PivotCharts
Advanced Level
- Dynamic-array functions
- LET and LAMBDA
- Power Query
- Power Pivot and data modelling
- What-If Analysis
- Solver
- Macros and VBA
- Dashboard design
Future-Ready Level
- Python in Excel
- Copilot in Excel
- Prompt writing
- Automated data preparation
- AI-assisted analysis
- Formula auditing
- Data governance
- Business storytelling
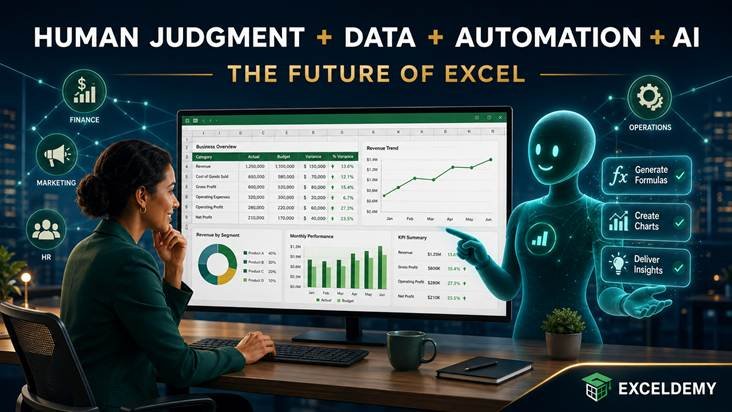
Figure 5. The future of Excel combines human judgement with data, automation and artificial intelligence.
Final Thoughts: Excel Is No Longer “Just a Spreadsheet”
Excel has evolved from a calculation grid into a flexible business-analysis environment.
Its continued success comes from a rare combination:
- It is easy enough for a beginner.
- It is powerful enough for an analyst.
- It is flexible enough for a manager.
- It is programmable enough for automation.
- It is familiar enough to be shared across departments.
- It is evolving fast enough to remain relevant in the age of AI.
Companies continue to use Excel because business problems are rarely identical. Organisations need a tool that allows people to explore, calculate, test, communicate and adapt—and Excel does all of these within one familiar environment.
The question is therefore no longer:
“Will Excel continue to be used?”
A better question is:
“How can we use modern Excel more intelligently, accurately and efficiently?”
Excel has travelled from formulas to functions, from PivotTables to Power Query, from macros to Python and from manual analysis to Copilot.
Its grid may look familiar, but what it can do in 2026 is remarkably different from what it could do in 1985.
The future of Excel is not only about spreadsheets. It is about combining human business understanding with data, automation and artificial intelligence.
Follow EXCELDEMY for practical Excel functions, shortcuts, business case studies, dashboards and industry-oriented learning.
Frequently Asked Questions
When was Microsoft Excel first released?
Microsoft Excel was first released for the Apple Macintosh in 1985. The Windows version followed in 1987.
Why do companies still use Excel?
Companies use Excel because it is accessible, flexible, familiar and suitable for calculations, data analysis, reporting, forecasting, visualisation and automation.
Is Excel useful for management students?
Yes. Management students can use Excel for finance, marketing, HR, operations, supply-chain analysis and business decision-making.
Will AI replace Excel skills?
AI can help create formulas, charts and reports, but users must still understand the data, verify the output and interpret its business meaning.
Is Excel better than Power BI or Tableau?
Each tool serves a different purpose. Excel is excellent for calculations and flexible analysis, while Power BI and Tableau are stronger for scalable, interactive dashboard reporting.
What are the most important Excel skills for employment?
Important skills include formulas, lookup functions, PivotTables, Conditional Formatting, charts, Power Query, data cleaning, dashboards, automation and analytical thinking.
Official Sources and Further Reading
- Microsoft Excel Turns 40
- Microsoft Power Query Documentation
- Microsoft’s Introduction to Python in Excel
- Microsoft Support: Get Started with Copilot in Excel
- What’s New in Excel—January 2026
- What’s New in Excel—May 2026
FOLLOW EXCELDEMY FOR PRACTICAL, INDUSTRY-ORIENTED EXCEL LEARNING